Show Your Talents
Interactive Radial Bar Chart for Research Interests & Skills
Published: December 04, 2025
About The Project
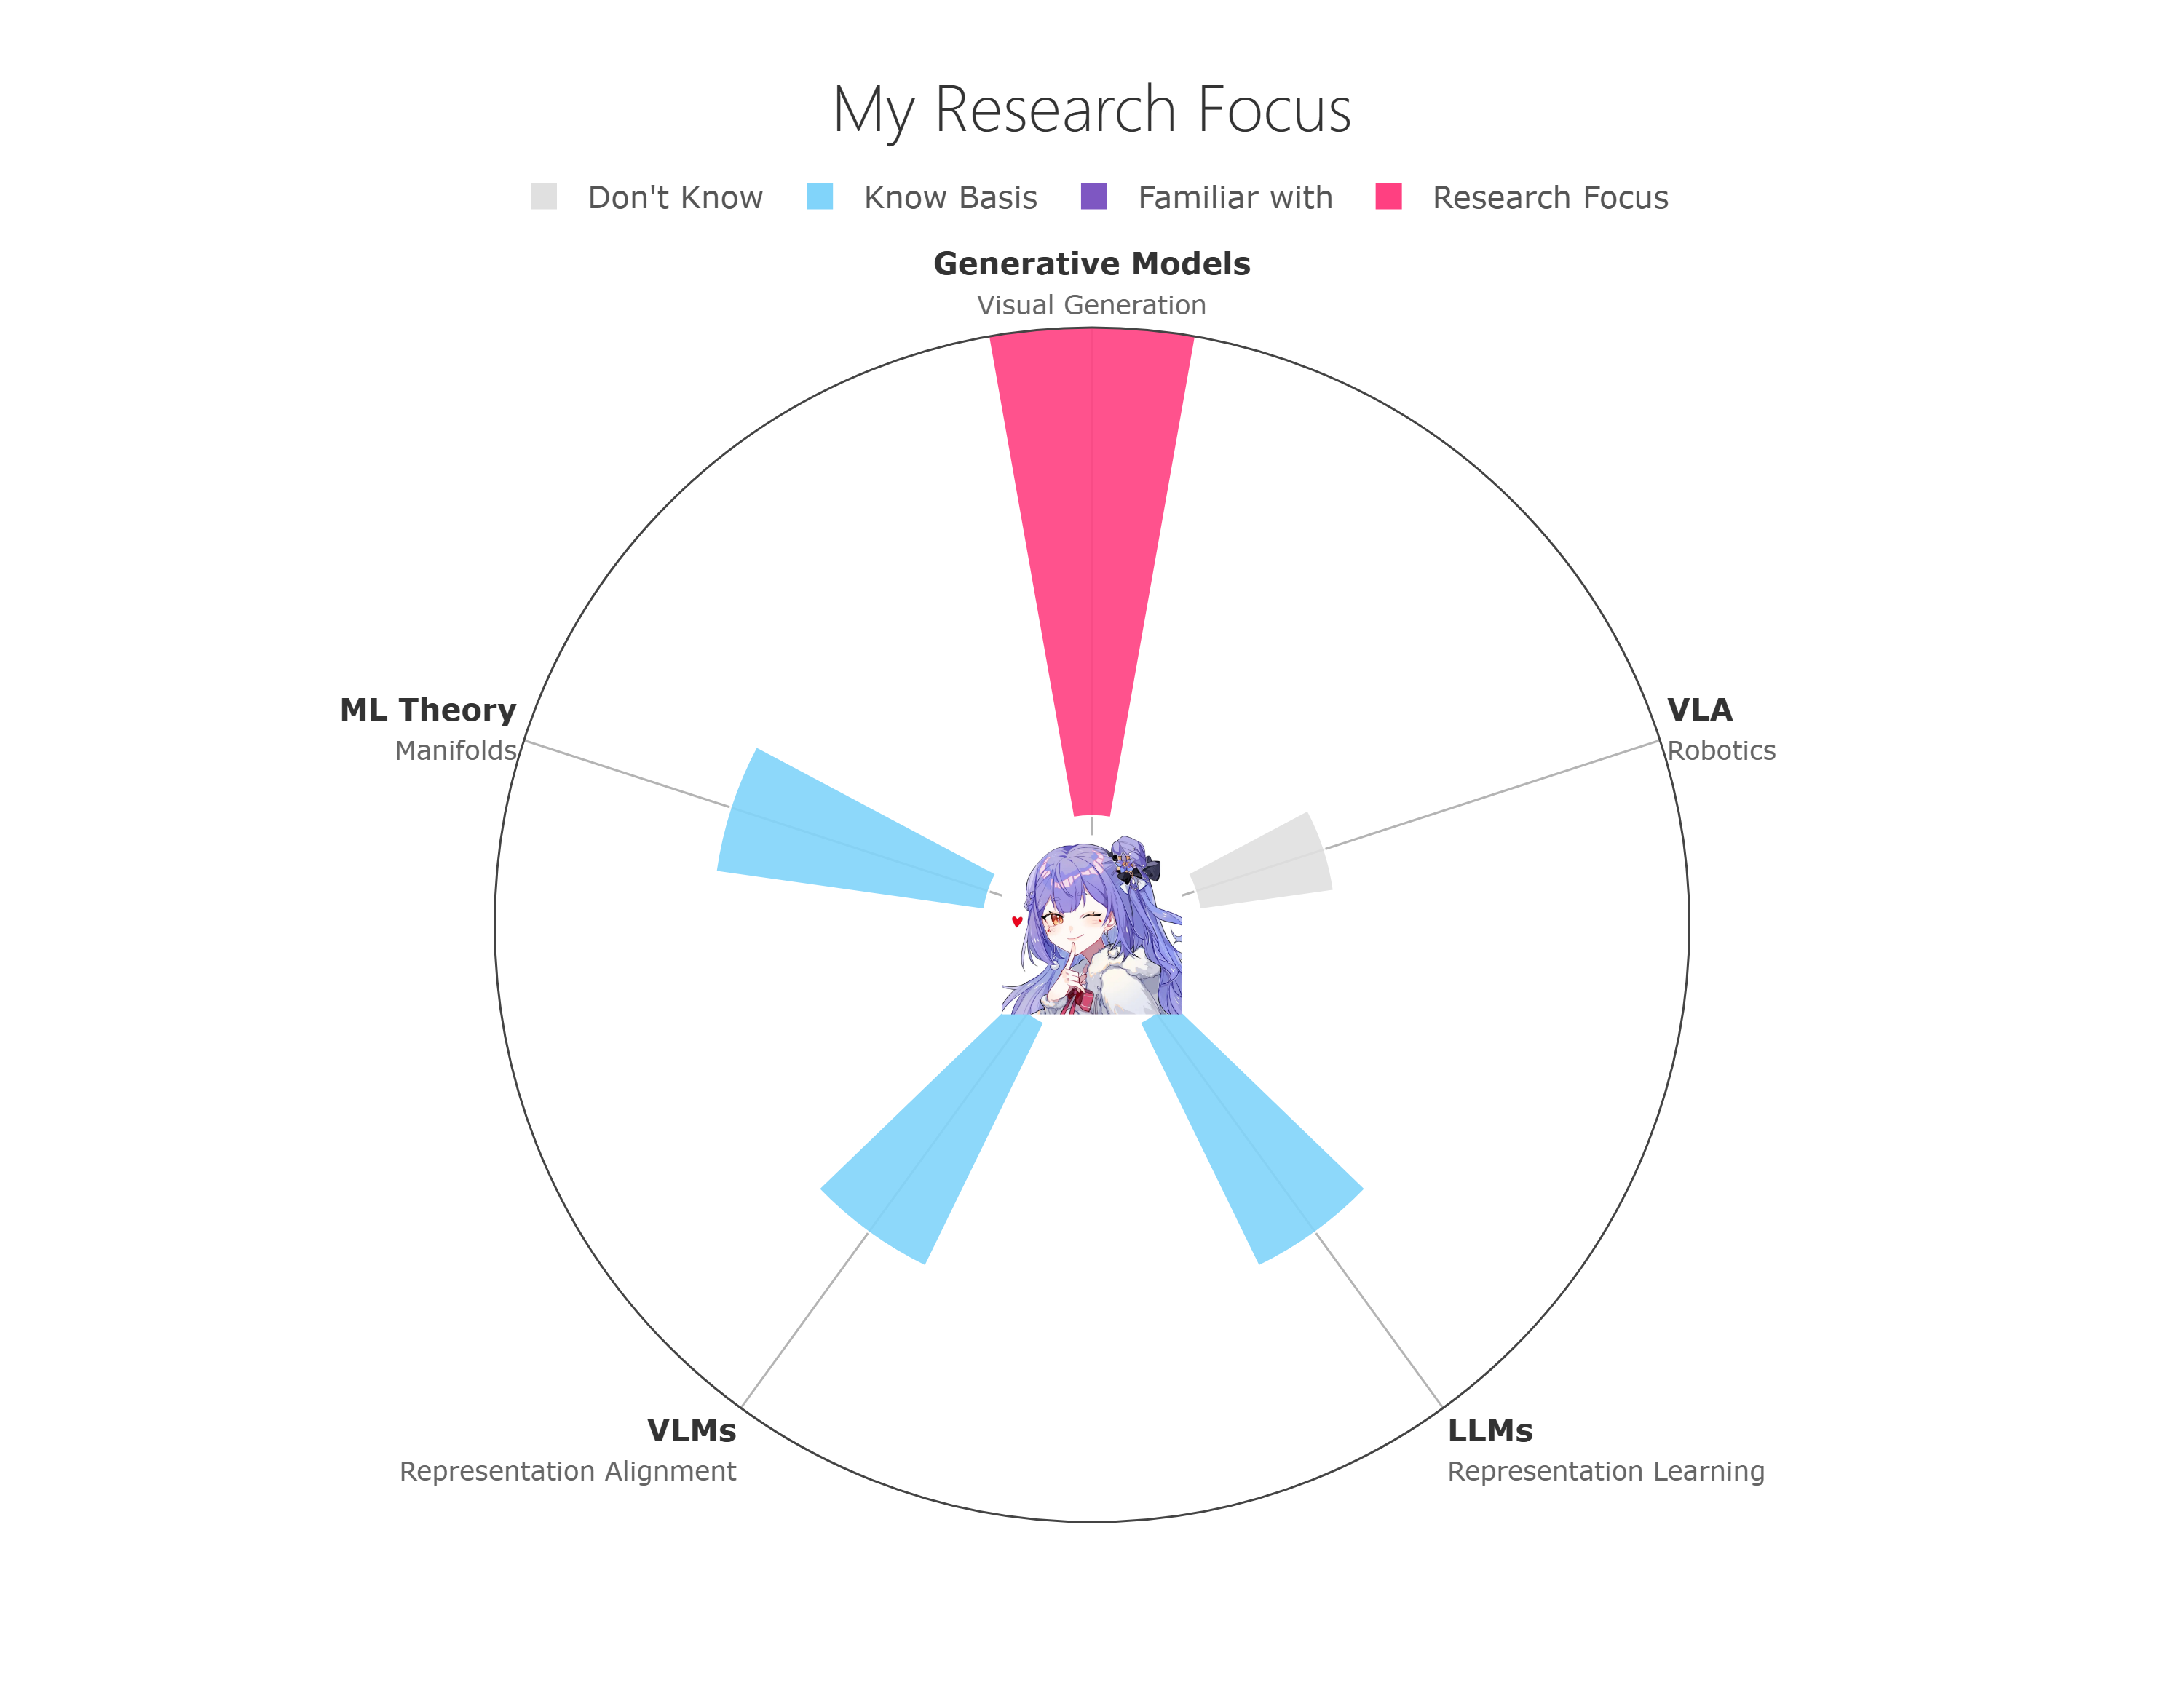
Show Your Talents is an open-source web tool designed to visualize research interests, skills, or any multi-dimensional data in an engaging, interactive radial bar chart. Inspired by academic profile metrics, it allows researchers, developers, and students to showcase their expertise in a visually appealing way.
Built with HTML5 and Plotly.js, it offers a lightweight and customizable solution for personal websites and academic portfolios.
Key Features
- 📊 Interactive Visualization: Hover over bars to see detailed metrics and values.
- 🎯 Multi-dimensional Analysis: Compare theoretical depth, applied experience, and potential across various categories.
- 🖼️ Fully Customizable: Easily update categories, data points, and the central profile image through simple configuration.
- 🚀 Easy Deployment: Pure static HTML/JS/CSS - works perfectly on GitHub Pages.
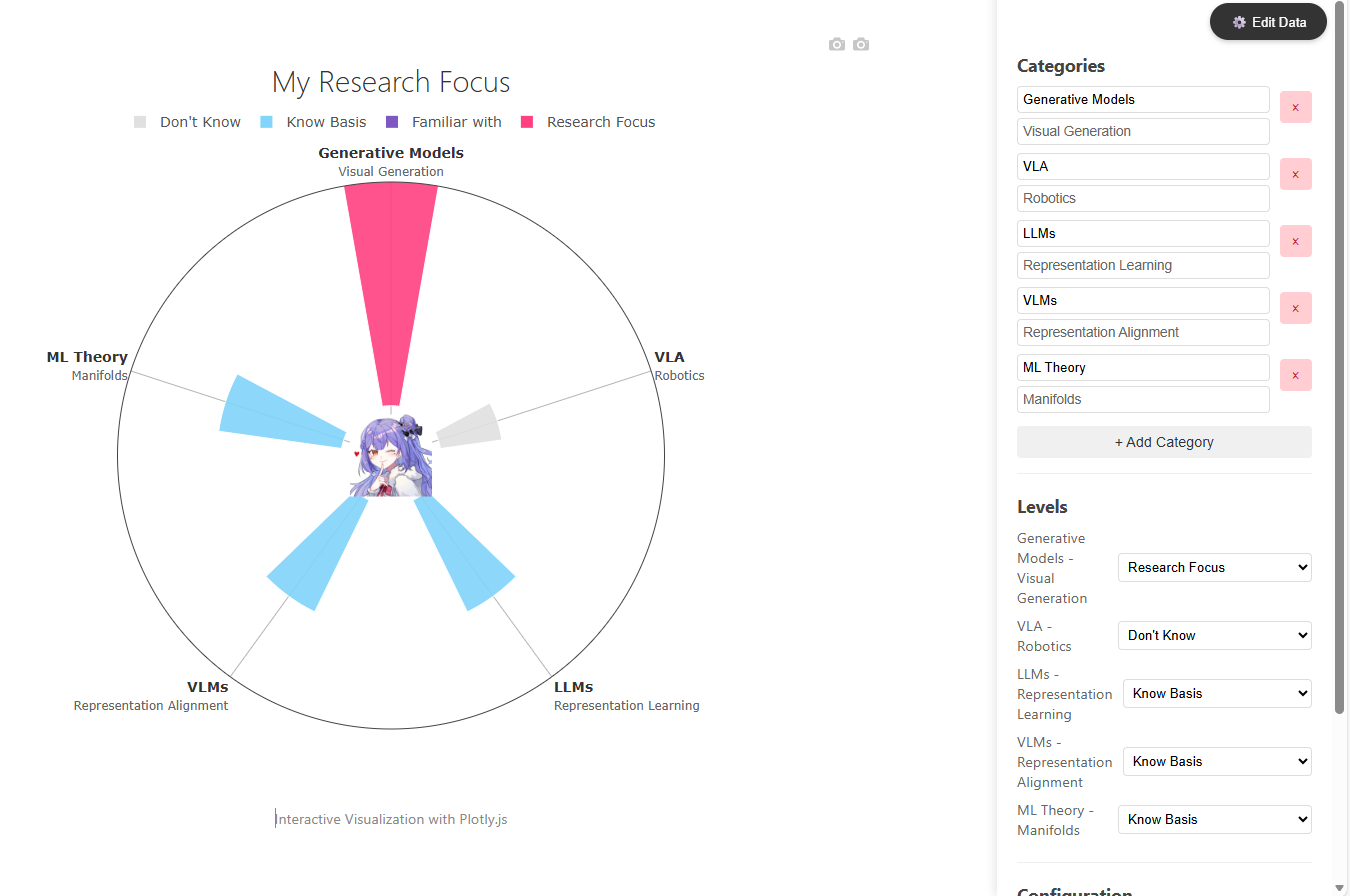
Easy-to-use configuration interface
Usage
Getting started is simple. Just clone the repository and edit the configuration:
- Clone the repository
git clone https://github.com/Bili-Sakura/Show-Your-Talents.git -
Customize Data Open
index.htmland modify thecategoriesandseriesarrays:// Example configuration const categories = ['AI', 'Computer Vision', 'NLP', 'Robotics']; const series = [ { name: 'Theory', data: [80, 90, 70, 60] }, { name: 'Practice', data: [70, 85, 75, 50] } ]; - Deploy Upload to any static hosting service like GitHub Pages.
Technologies Used
- HTML5 / CSS3: For structure and styling.
- Plotly.js: For rendering the interactive charts.
🔗 Ready to Visualize Your Skills?
Check out the repository and star it if you find it useful!
GitHub: Bili-Sakura/Show-Your-Talents